Power Draw Profile for Trimble NetRS and Iridium Systems
Power Draw Profile for Trimble NetRS and Iridium System
Test Summary
UNAVCO performed a benchtop test to record a high-resolution time history of power consumed by a Trimble NetRS GPS system with Iridium communications. The test system consisted of a Trimble NetRS receiver with Trimble Choke Ring antenna, NAL Research A3LA-I modem with SAF5350C antenna, Flexcharge NC30L12 solar regulator, and an ABB RS1A44 timer switch. This system represents the UNAVCO best-practices polar GPS station as of June 2006.
The test was performed at room temperature. A variable DC power supply was used to deliver 12.0 VDC to the battery input terminals on the power board, with current and voltage recorded at 10 Hz by a data acquisition computer running LabView. The data acquisition routine clipped the current burst signals above 1 amp (12 W) during Iridium data download, however this threshold was usually close to the true peak height of the ~0.1 second pulses. For longer duration, stronger bursts, a conservative visual estimation of the true peak height was made and used in calculating the power consumption during data download.
Test Sequence:
Power full system with 12.0 VDC.
Allow components to boot up and assume steady-state operation.
Disconnect Iridium modem for 1 minute.
Reconnect Iridium modem and allow system to return to steady-state operation.
Execute Iridium download script: call Iridium modem and download small GPS data file.
Call was dropped.
Iridium download script redials and second call is initiated. Call is user-terminated.
Turn off entire system. Disconnect Iridium modem.
Turn on system and allow system to reboot and assume steady-state operation (w/o Iridium).
Disconnect power.
Results
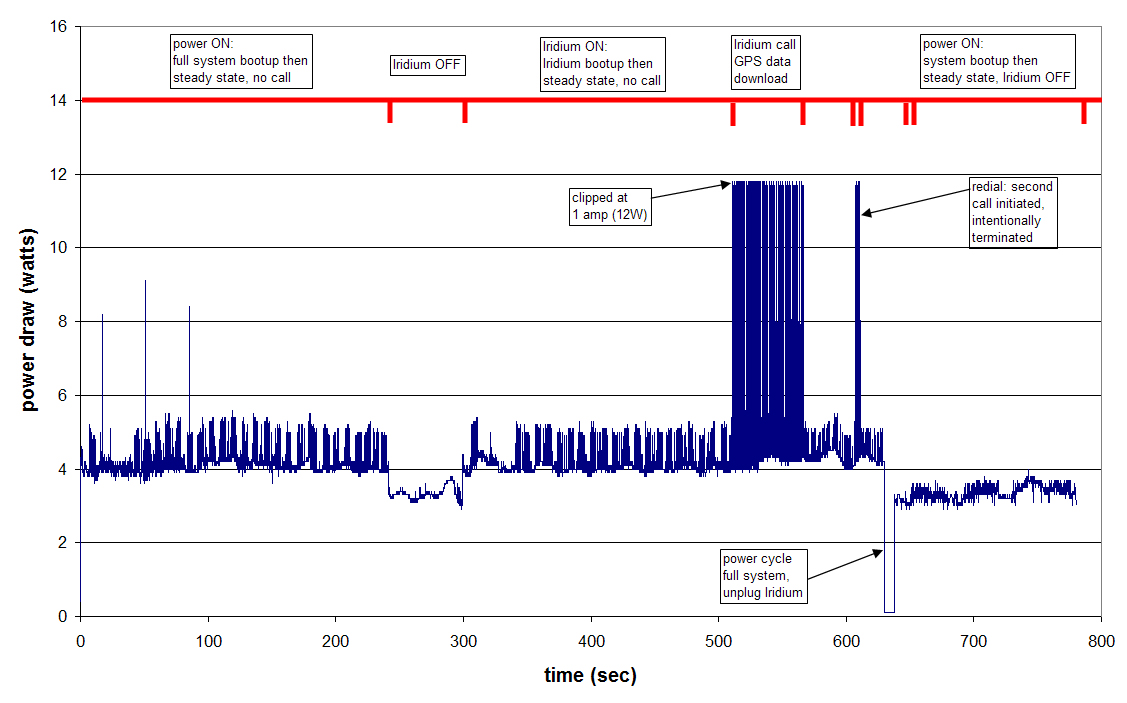
The average power draw of the GPS receiver, timer switch, and solar regulator combined is 3.35 W.
If the Iridium modem is powered with no data download underway, the system average power draw is 4.15 W.
When a data download is underway, the average power draw is 6.25 W.
The measured power draw time series is presented in the figure below.

)