GNSS Receiver Evaluations 2012
This article provides a summary of UNAVCO’s comparison of the current state-of-the art hardware from 5 major manufacturers. It will include comparisons of receiver data quality in the following areas: double difference phase residual RMS; qualitative comparisons of L2C signal to noise observations (S2); and tracking performance.
In addition to the summary that follows, a general comparison of features has been tabluated in an Excel spreadsheet. The spreadsheet is available for download here (~62KB).
Another interesting source for receiver information is GPS World’s 2012 receiver survey: http://www.gpsworld.com/professional-oem/2012-receiver-survey-12695
Receivers tested in this article:
- Javad Sigma
- Leica GR10
- Septentrio PolaRx4 Pro
- Topcon Net-G3A
- Trimble NetR9
For the results presented in this article we used the following testing configuration:
- Multipath mitigation was turned off on all receivers.
- Tracking loop parameters were set to thier default settings.
- All receivers were connected to the same Trimble choke-ring antenna (TRM59800.00) via an 8-way powered splitter (GPS Source).
- The GAMIT/GLOBK software was used to generate position estimates and double difference phase residuals.
- Five 24-hour, 1-second files were collected from each receiver.
- Receivers were set to track all satellites to 0º elevation.
- Code and carrier smoothing was turned off on all receivers.
Note: If you would like access to any of the data used for this report, please email Henry Berglund at berglund@unavco.org.
Results
Phase Residual RMS
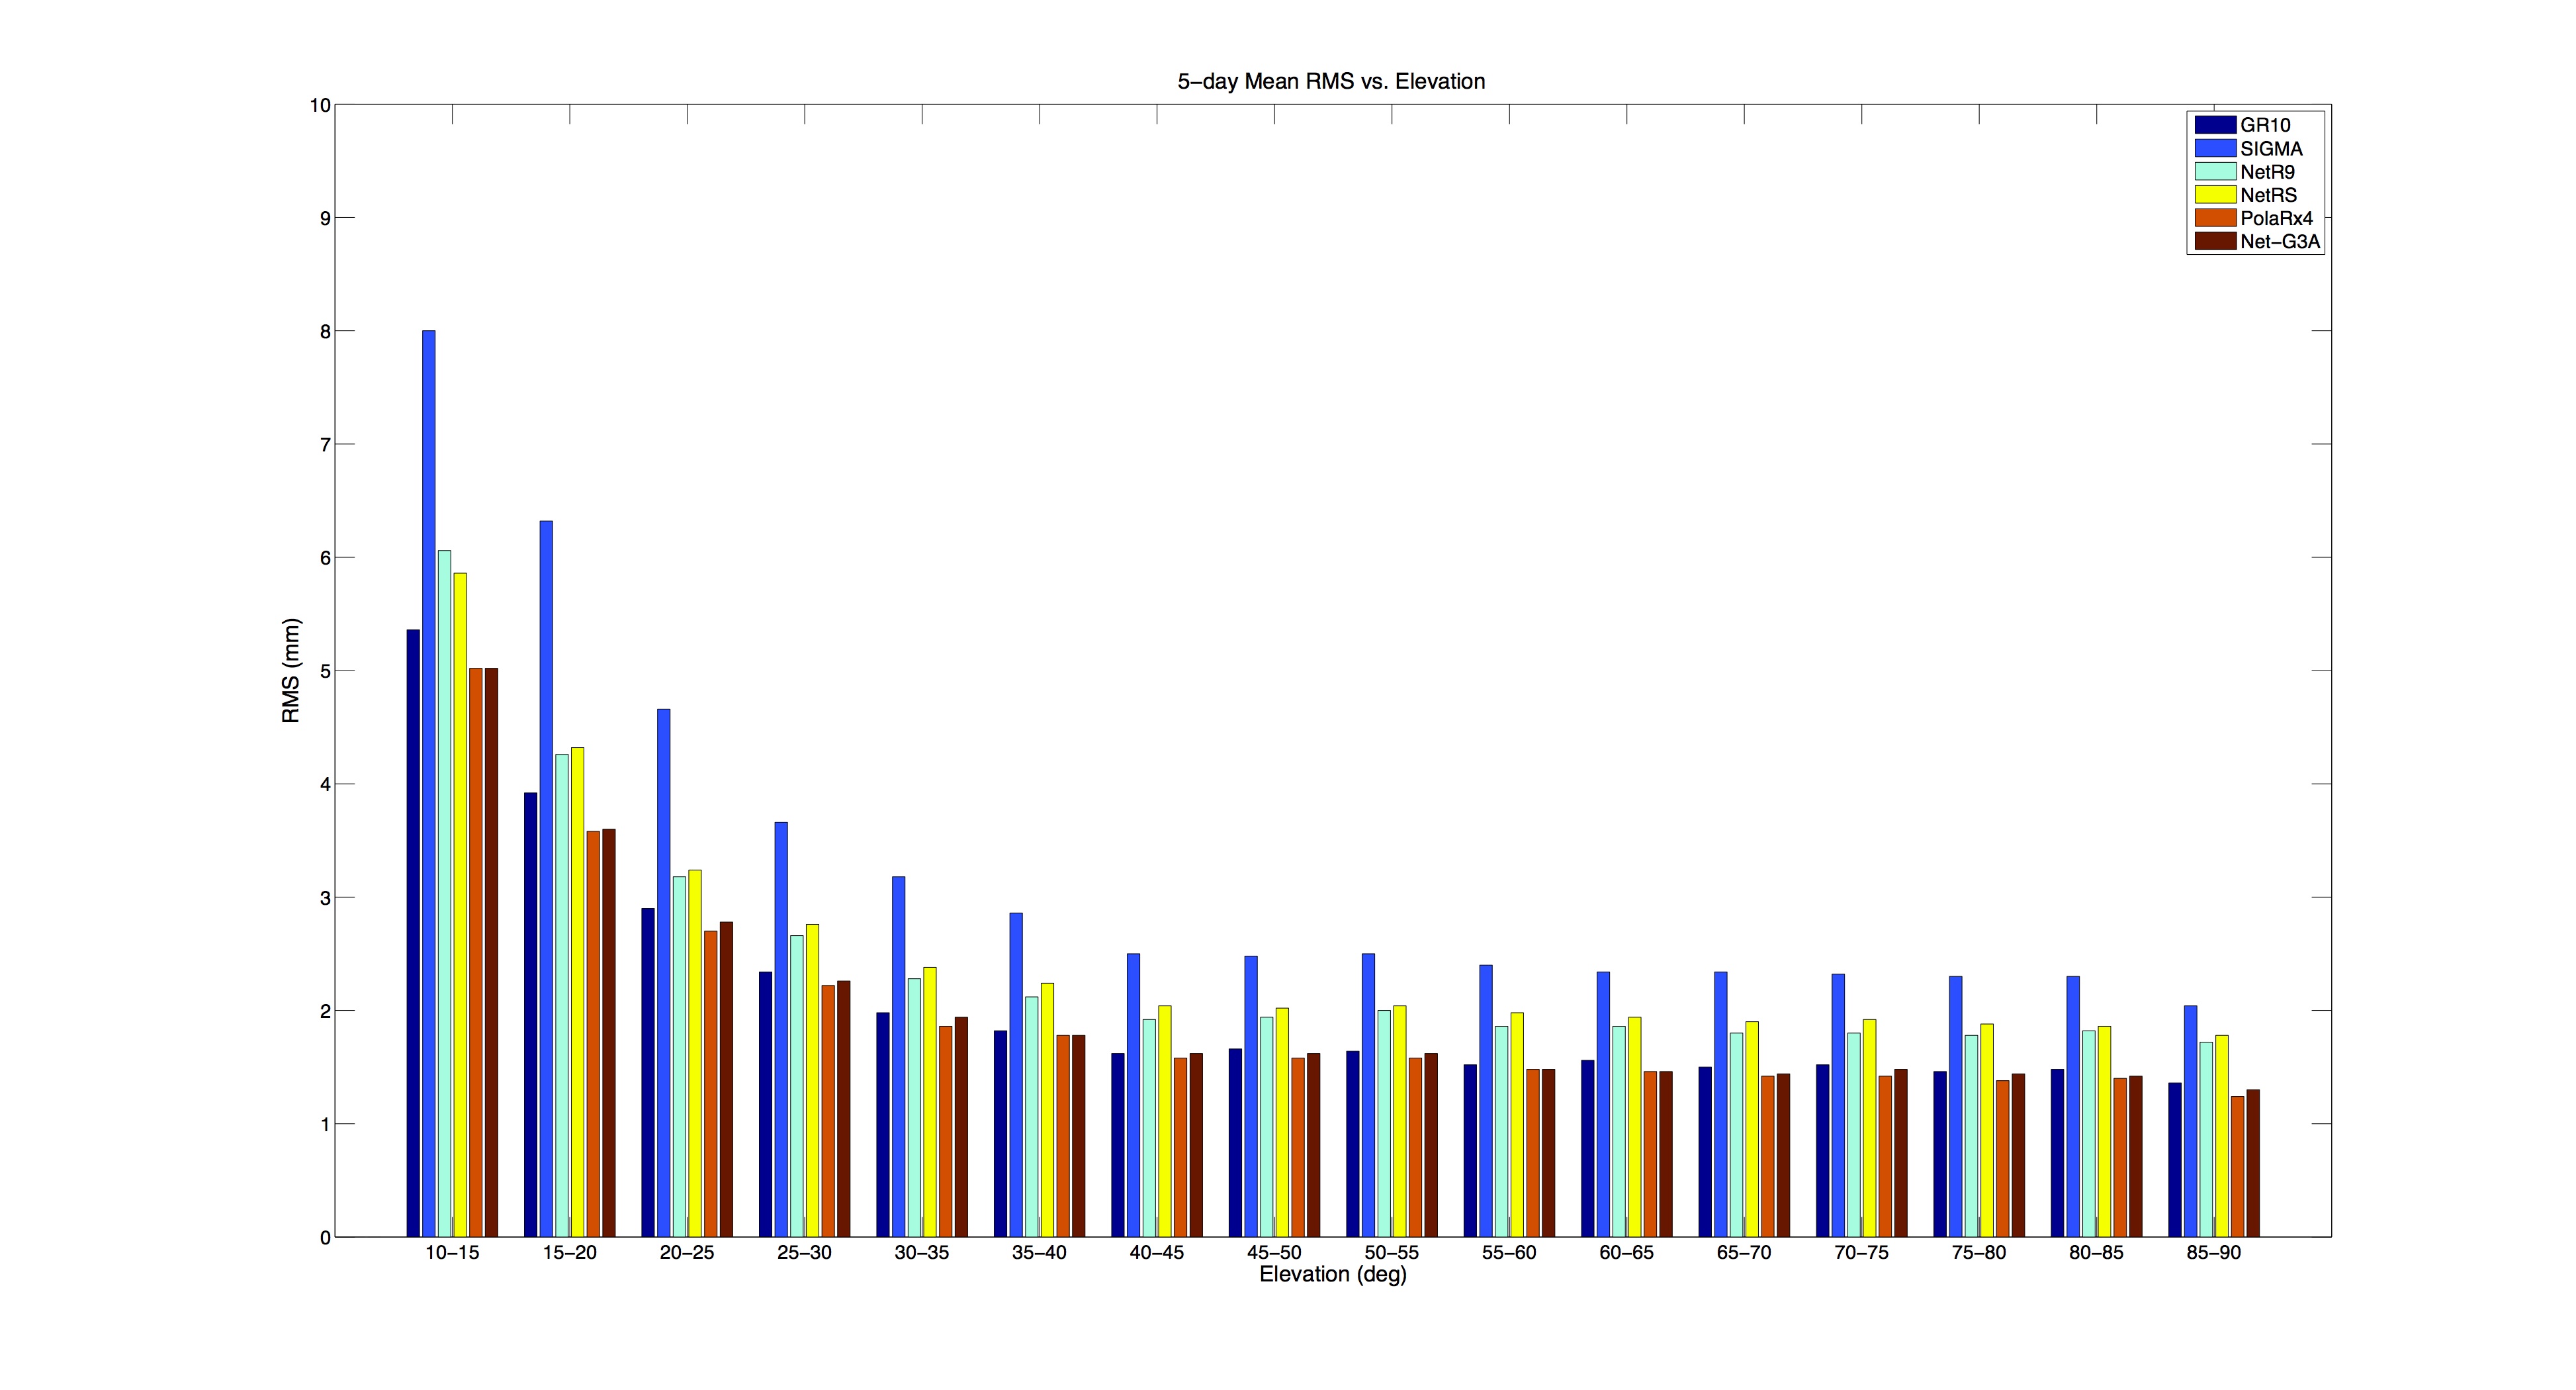
The following figure shows the average phase residual RMS from double-differenced carrier-phase processing using the GAMIT software package. The RMS is binned by elevation angle along the x-axis in 5-degree intervals. The y-axis is RMS in millimeters. Each bin is a 5-day average of the computed LC RMS (LC = 2.546*L1 – 1.984*L2). At all elevations the RMS of the Javad SIGMA was the highest. This may indicate that the default carrier tracking loop bandwidth of the Javad Sigma is greater than the other tested receivers. Only three of the tested receivers allow adjustments to the tracking loop bandwidth: Javad Sigma, Topcon Net-G3A and Septentrio PolaRx4 Pro. As tracking loop bandwidth increases, dynamic performance of a given receiver will also improve. Conversely, noise performance will decrease as tracking loop bandwidth increases (RMS). Addtional testing of receiver performance in dynamic environments need to be undertaken before determining the optimal balance of minimizing noise while maintiaining lock during shaking.

L2C Signal to Noise
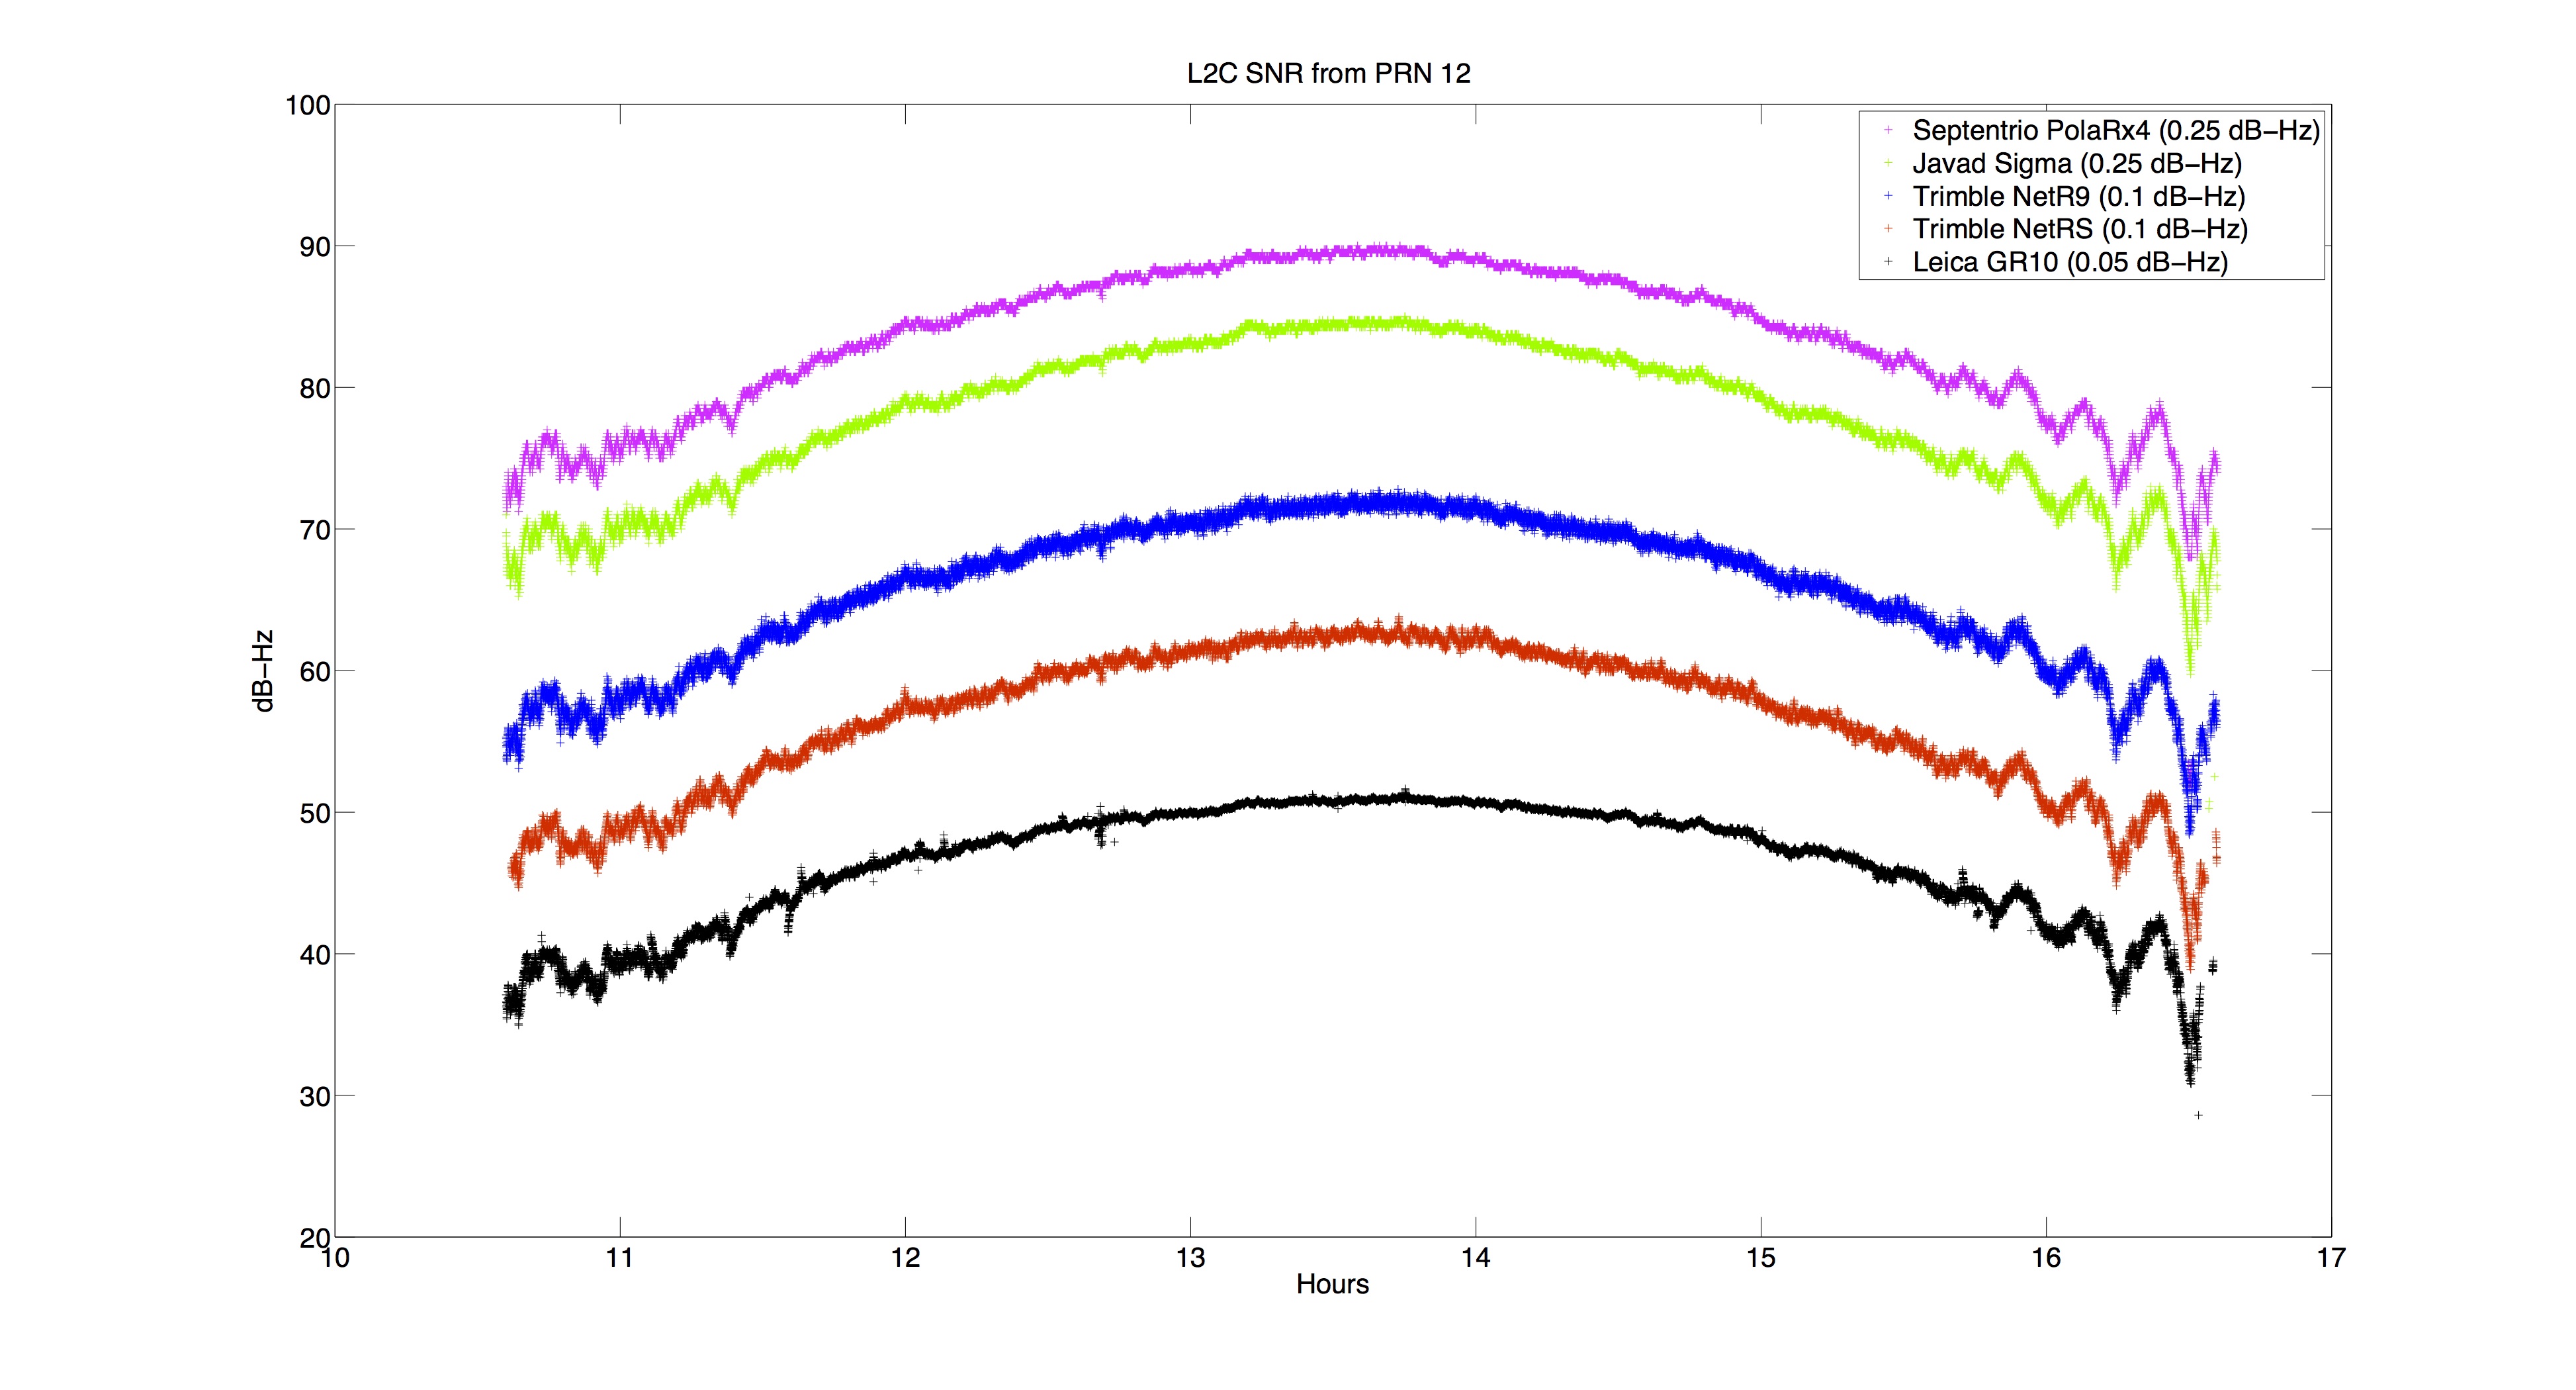
The following figure shows the L2C signal to noise from PRN12. The x-axis is in hours and the y-axis is in dB-Hz. Each curve is offset by 10 dB-Hz for clarity. From top to bottom we have: the PolaRx4 Pro, the Sigma, the NetR9, the NetRS and the GR10. The SNR resolution of these receivers varies from 0.05-0.25 dB-Hz. The Leica GR10 has the highest output resolution. While trying to plot the SNR data from the Topcon Net-G3A receiver in 0.1 dB-Hz resolution, a firmware bug was discovered and reported to TOPCON. Due to the bug, we were not able to include the results from the Topcon Net-G3A with this report. Future firmware releases should address the issue.

Tracking
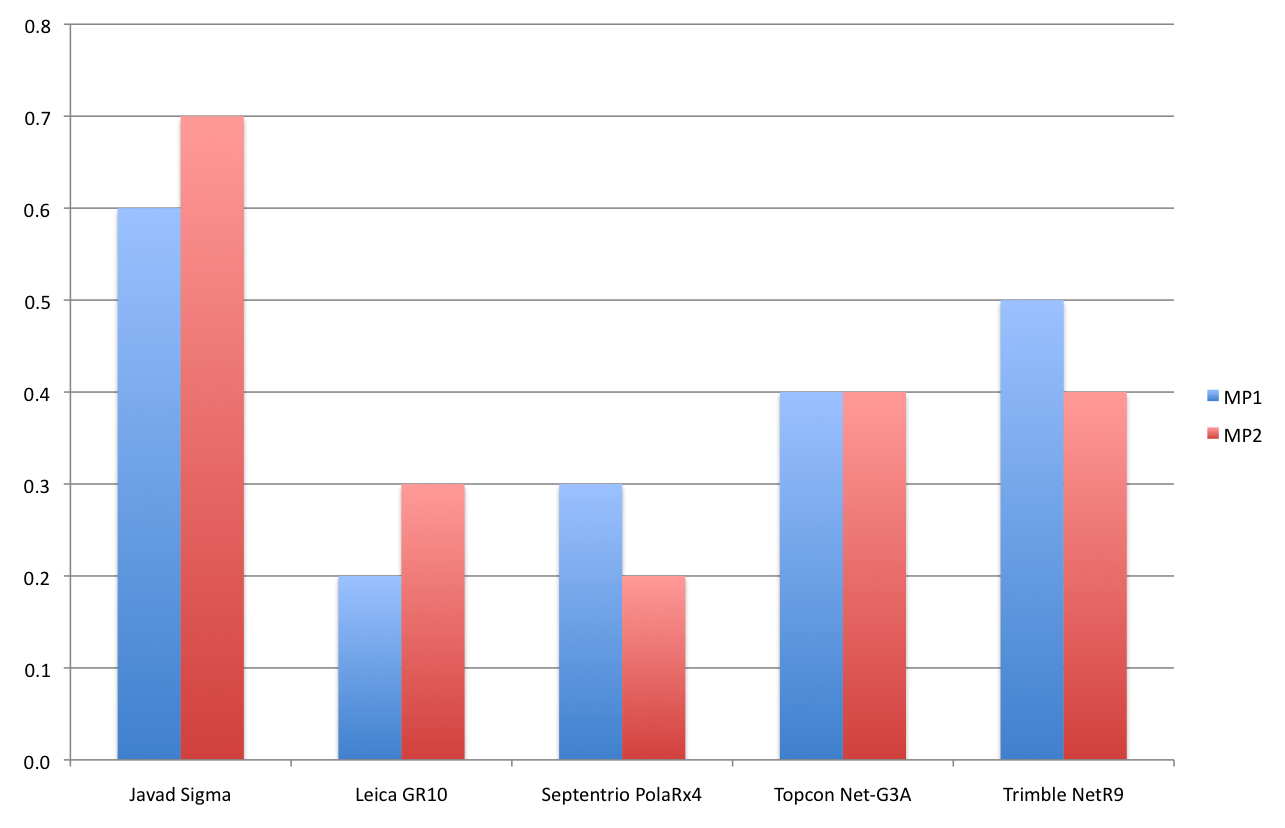
The following figure shows the average RMS of the MP1 and MP2 combinations over a 5-day period for each receiver. These values were computed by Teqc.

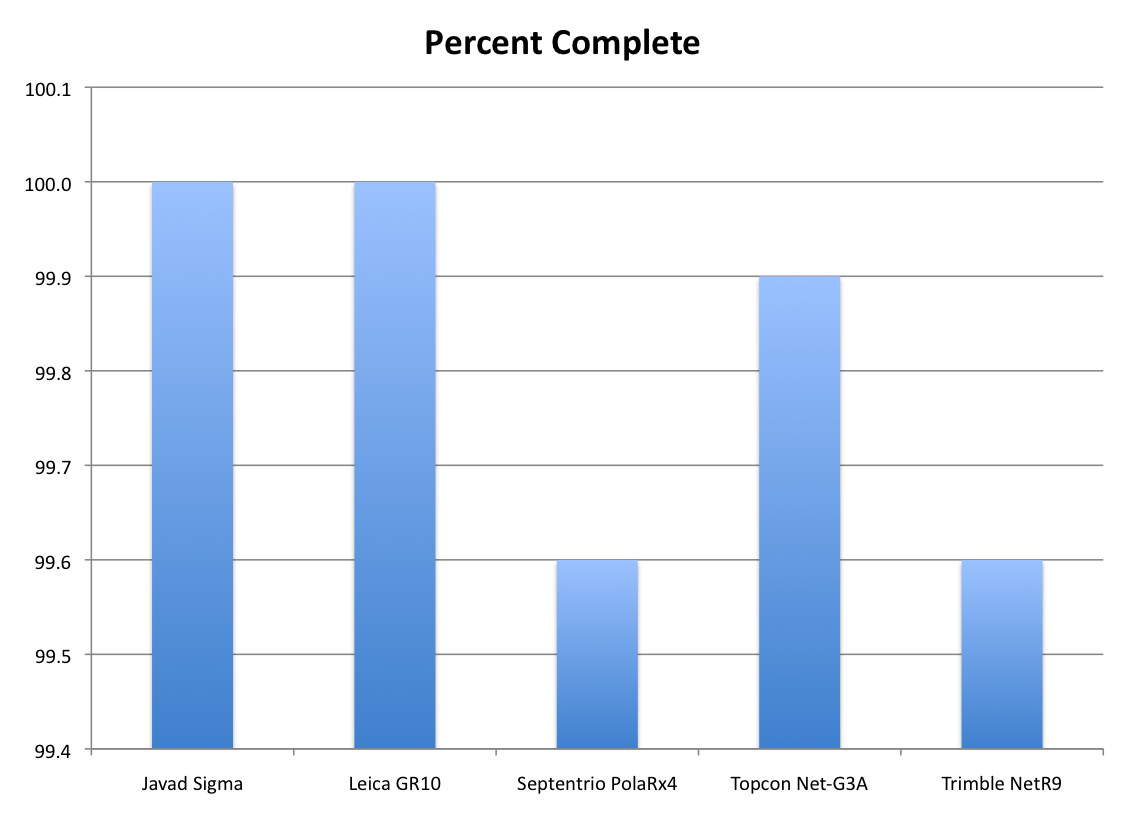
The following figure shows the number of recorded observations divided by the number of expected observations for each reciever. These values were computed by teqc and a 10-degree elevation mask was used. All of the receivers logged more than 99% of the expected observations. Only the Javad Sigma and Leica GR10 logged 100% of the expected observations. This is for GPS L1 and L2 signals only.

The following figures show the average number of detected cycle slips that occured during our 5-day test. The upper figure shows the number of slips that were detected for satellites with elevations angles greater than 10 degrees. The lower figure shows the number of slips that were detected for satellites with elevation angles less than 10 degrees.


)