Open TGO. Select "New Project".
Give the project a name. For template, select Metric. Click Okay.
Change Project Properties as needed. If you collected your survey data in a particular coordinate system, click on the Coordinate System tab and change to the coordinate system used in your survey. Note that all project properties can be easily adjusted after data import by selecting Projects from the left-hand menu/tab and then selecting Project Properties.
The map should be blank. Select Import from the left-hand menu/tabs.
Select your base station data first. [Note: TGO does not read .T00 and .T01 files; if you have not already converted your static survey data (base station and, if applicable, other static points) to .dat files, do so by right-clicking on the file and selecting ’Convert to .dat.’ This will only work if TGO and/or the Trimble Data Transfer Utility are installed.] Select ’DAT File’ from the left-hand menu, browse for and select your data file, and hit ’Open.’ If you have more than one data file pertaining to your base station, you can select all of them by holding the ’Ctrl’ key, and open them simultaneously.
A table showing your data file(s) should come up. Check that the information shown is correct. If it is not, correct it (e.g. site name, antenna type, antenna height, antenna height measurement method) by clicking the box to change and either selecting the correct value from the resulting drop-down menu or enter the correct value by hand. Data pertaining to the same marker should have the same name. Similarly, data pertaining to different survey points must have different names, or they will be merged. Click ’OK’ when done.
If a projection has not been defined during project surveying, you will be prompted to enter a grid value for your base station (or whatever data point you are importing first). Enter a value and click ’OK.’ Your data point will appear on the map. Double-click on the point to see point properties. If needed, you can change properties such as antenna height here.
If desired, show point names on the map by right-clicking the map screen and selecting Point Labels-->Name-->OK.
Import the rest of your data. Select Import from the left-hand menu/tabs and select the appropriate file format (e.g. Survey Controller DC File for a kinematic survey collected in a survey controller). Browse for the desired file(s). Survey controller files show up with the file extension .dc. Hit Open.
As with the base data, check to make sure the occupation information is correct, especially point names, antenna types, antenna heights, and antenna height measurement methods. Note that a ’Roving Segment’ represents data collected between specified data collection (the rover collects data continuously, even when survey objectives are not specified) and should not be selected. A ’Continuous Segment’ represents desired data and should be selected.
Error messages are not uncommon and can often be ignored. Still, it’s a good idea to review the import report to see if there is an understandable error. A likely error message after importing ’rover’ data is that your starting point is of low or unknown quality. Ignore this for now.
Your points should now be visible on the map. Baselines between static points will show in gray. (A baseline is the distance and direction between two points, and can only be acquired between points with data collected simultaneously.) Baselines to continuous survey points will not show up until data have been processed.
Give your base known coordinates. [If you do not already have high-confidence coordinates for your base, see Campaign Surveys - How to obtain high-confidence coordinates for a base station.] Double-click on the base point. In the resulting window, click on the ’beach ball’ in the upper right and select the appropriate coordinate system. Enter the desired coordinates and change the confidence levels in the drop-down menus on the right to Control Quality. Select the field coordinate (indicated with a ’beach ball’) from the list on the left. Delete this coordinate by clicking the red ’x’ in the upper right. This coordinate will still exist in your original job file. Close the Properties box.
Make sure nothing in your project is selected (the same in this case as selecting everything). Select "Survey" from the upper menu and then "Process GPS Baselines."
A window showing processed baselines will appear, listing some statistics. Check to make sure all the baselines are selected before clicking "Save." Note any baselines that were not selected automatically; this indicates poor statistics on the baseline solution.
All baselines should now show up in color. Yellow indicates a statistically sound baseline, while red indicates a compromised baseline. Red baselines in a kinematic survey are generally fine; red baselines in a static survey should be further explored. To view the project without baselines shown, go to View-->Plan.
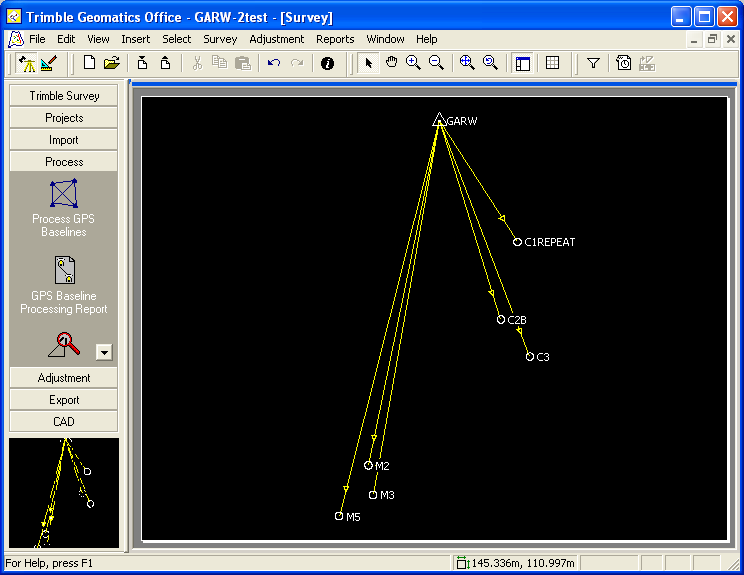
Example from Garwood valley, Antarctica showing a processed fast-static survey.
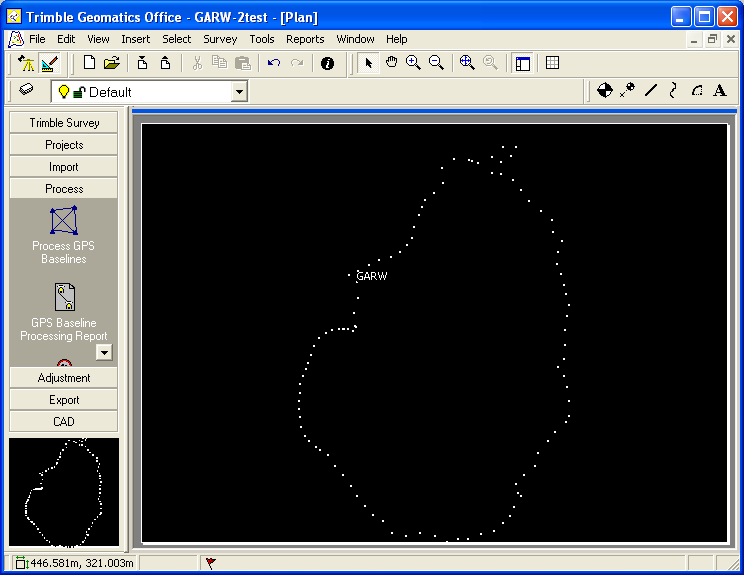
Example from Garwood valley, Antarctica showing a post-processing kinematic survey with baselines hidden.
To view the distance between two points, select Survey-->Inverse-->select points from the map by clicking on each one.
Export your results. For a comma delimited format appropriate for spreadsheets e.g. Excel, select the Export menu/tab from the left-hand menu and then Pt,N,E,E,Code. Select Custom from the top tabs. Select the appropriate information for export (or select ’New format...’ and create your own combination), click OK.
Close TGO when done. Your project is automatically saved.