)
GNSS Antenna Signal to Noise Comparison
This article presents a comparison of measured signal to noise ratio (SNR) values observed from several GNSS antenna types. The results presented below were collected using a monument located on the UNAVCO Facility Roof in Boulder, CO. Each test antenna was installed on the test monument for approximately one week.
Utilizing the same monument for the duration of the experiment reduces the error contribution from near-field and far-field site dependent effects. To reduce the impact of ionospheric and troposheric effects we computed four day averages of SNR in 5 degree elevation bins for each antenna type.
The same receiver was used throughout the experiment. Signal to noise observables obtained from different receiver types can vary significantly. Receiver manufactures apply different algorithims to obtain the S1 and S2 observables reported in the RINEX format.
GPS S1 and S2 observables were analyzed. GLONASS S1 observables were also evaluated.
Experiment Location: UNAVCO Facility Roof
Antenna List:
- LEIAR20
- SEPCHOKE_MC
- TPSCR.G3
- TPSPG_A1+GP
- TRM41249.00
- TRM57971.00
- TRM59800.00
- TRM59900.00
Test Receiver Model:
- Trimble NetR8
- 24hr, 30sec sessions
Results
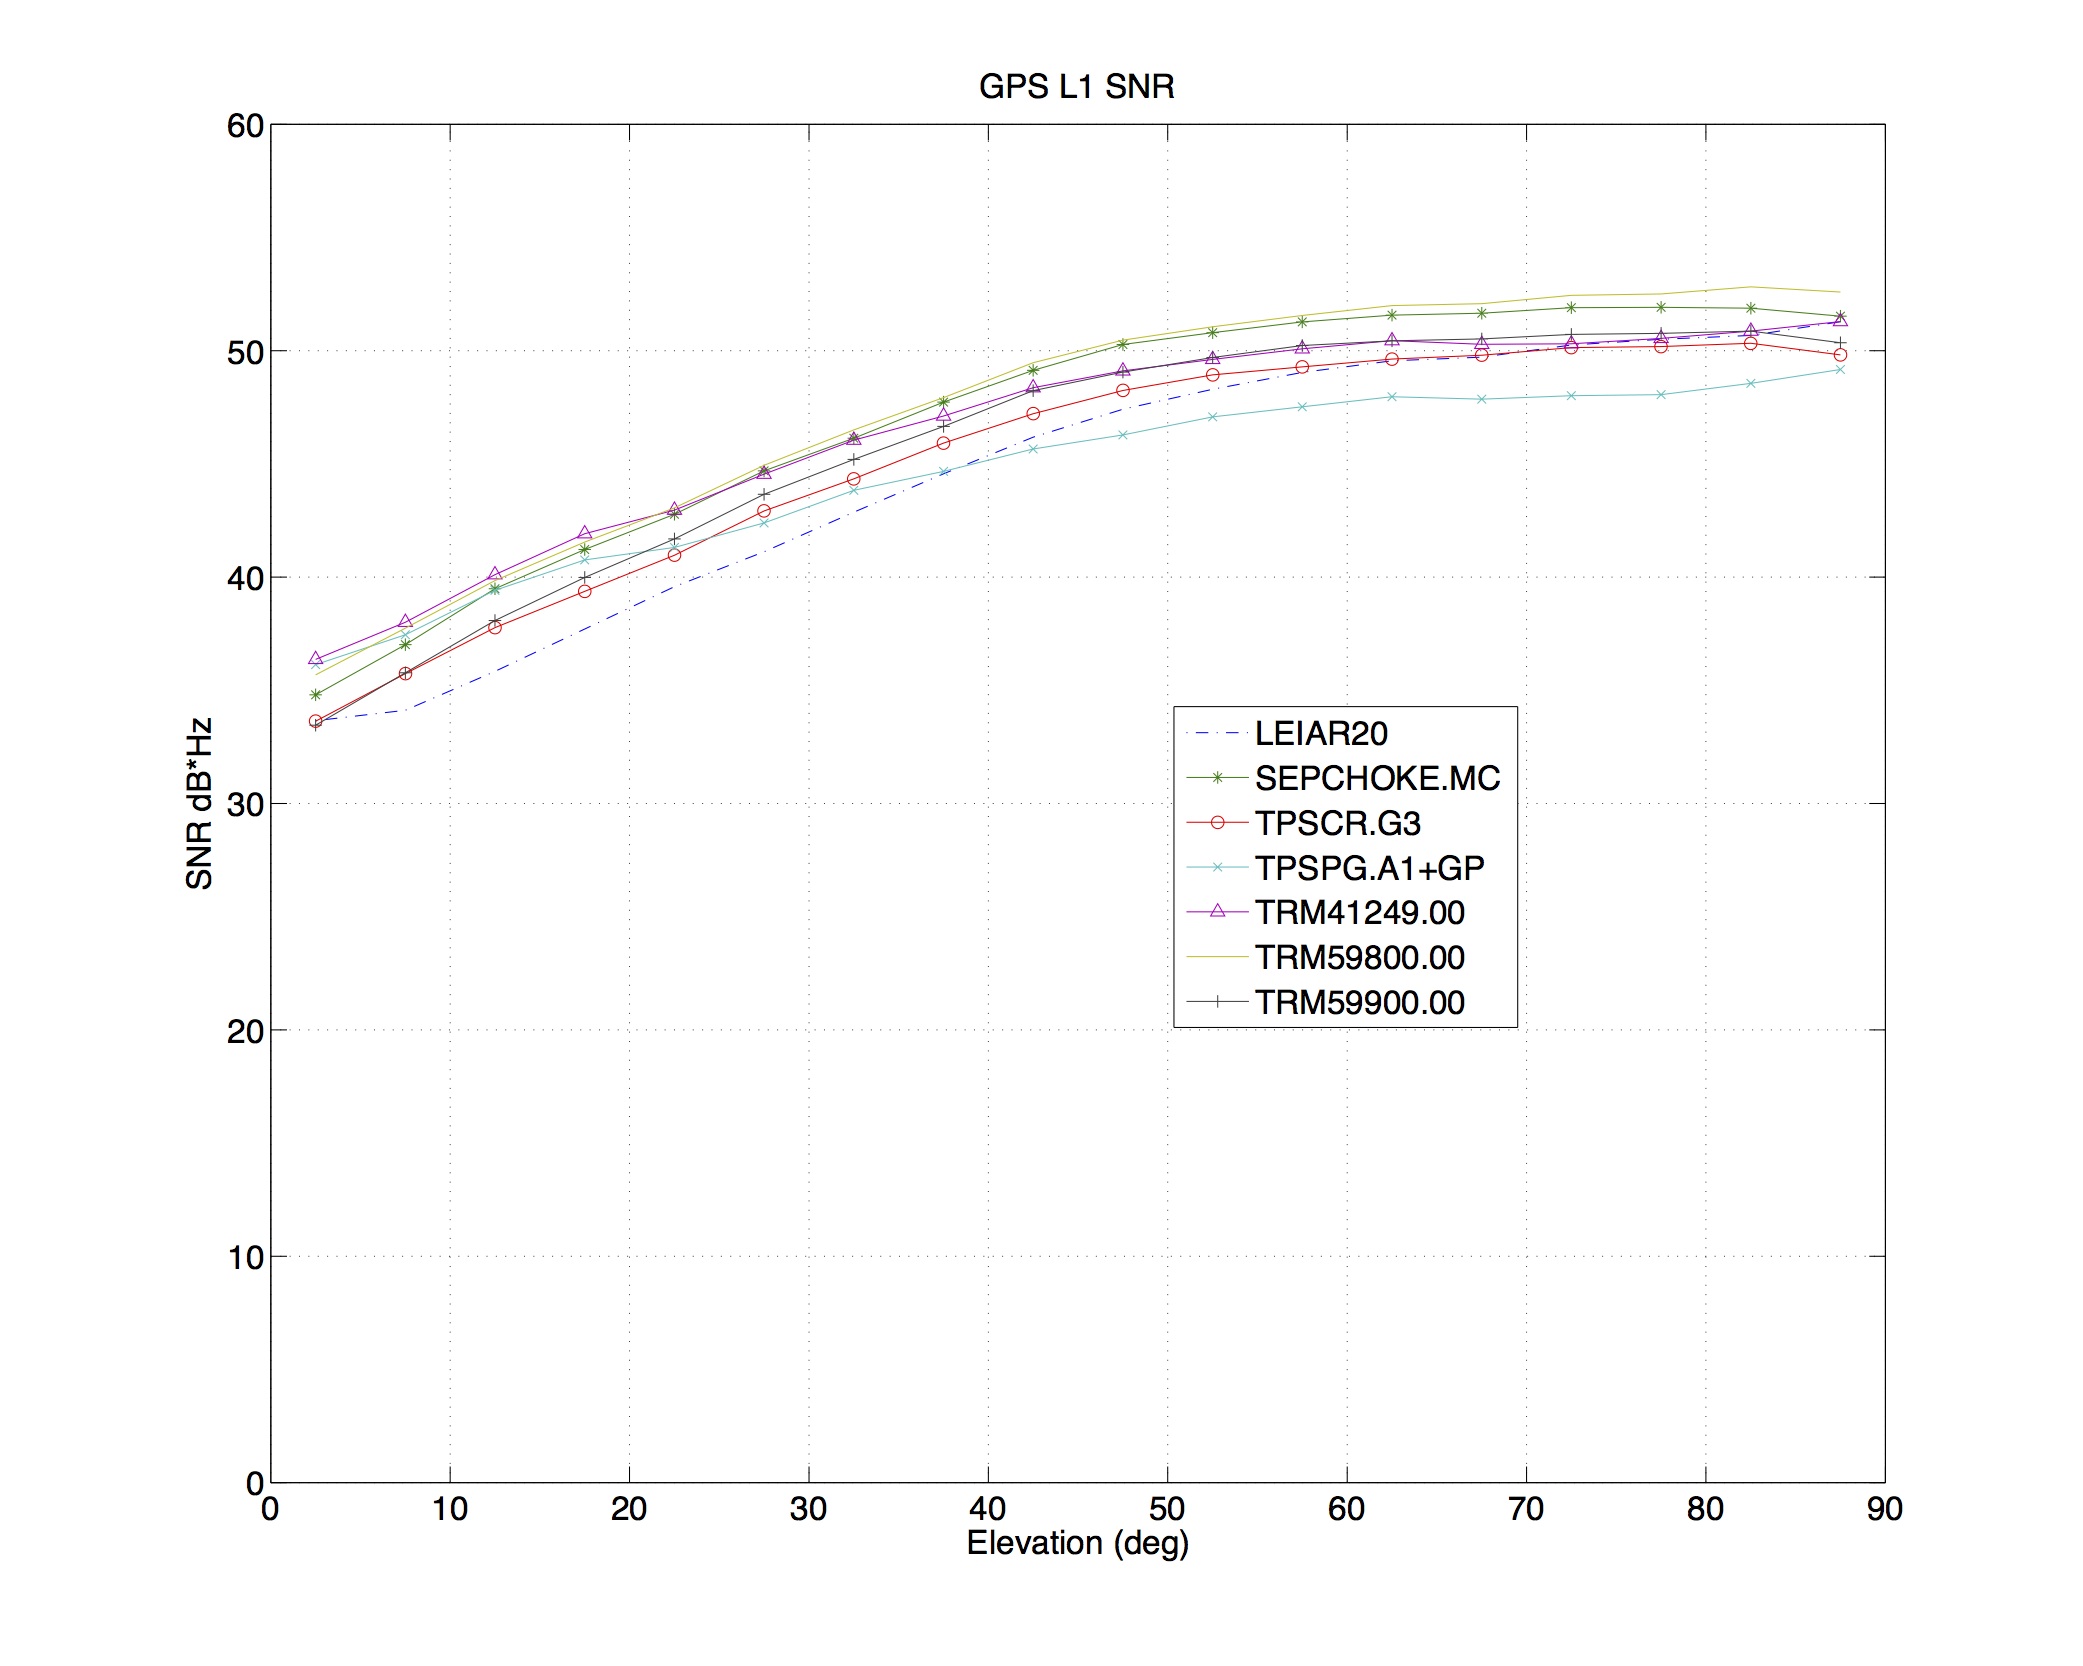
Figure 1. Computed four day averages of S1 in 5 degree elevation bins for each antenna type. (full size)
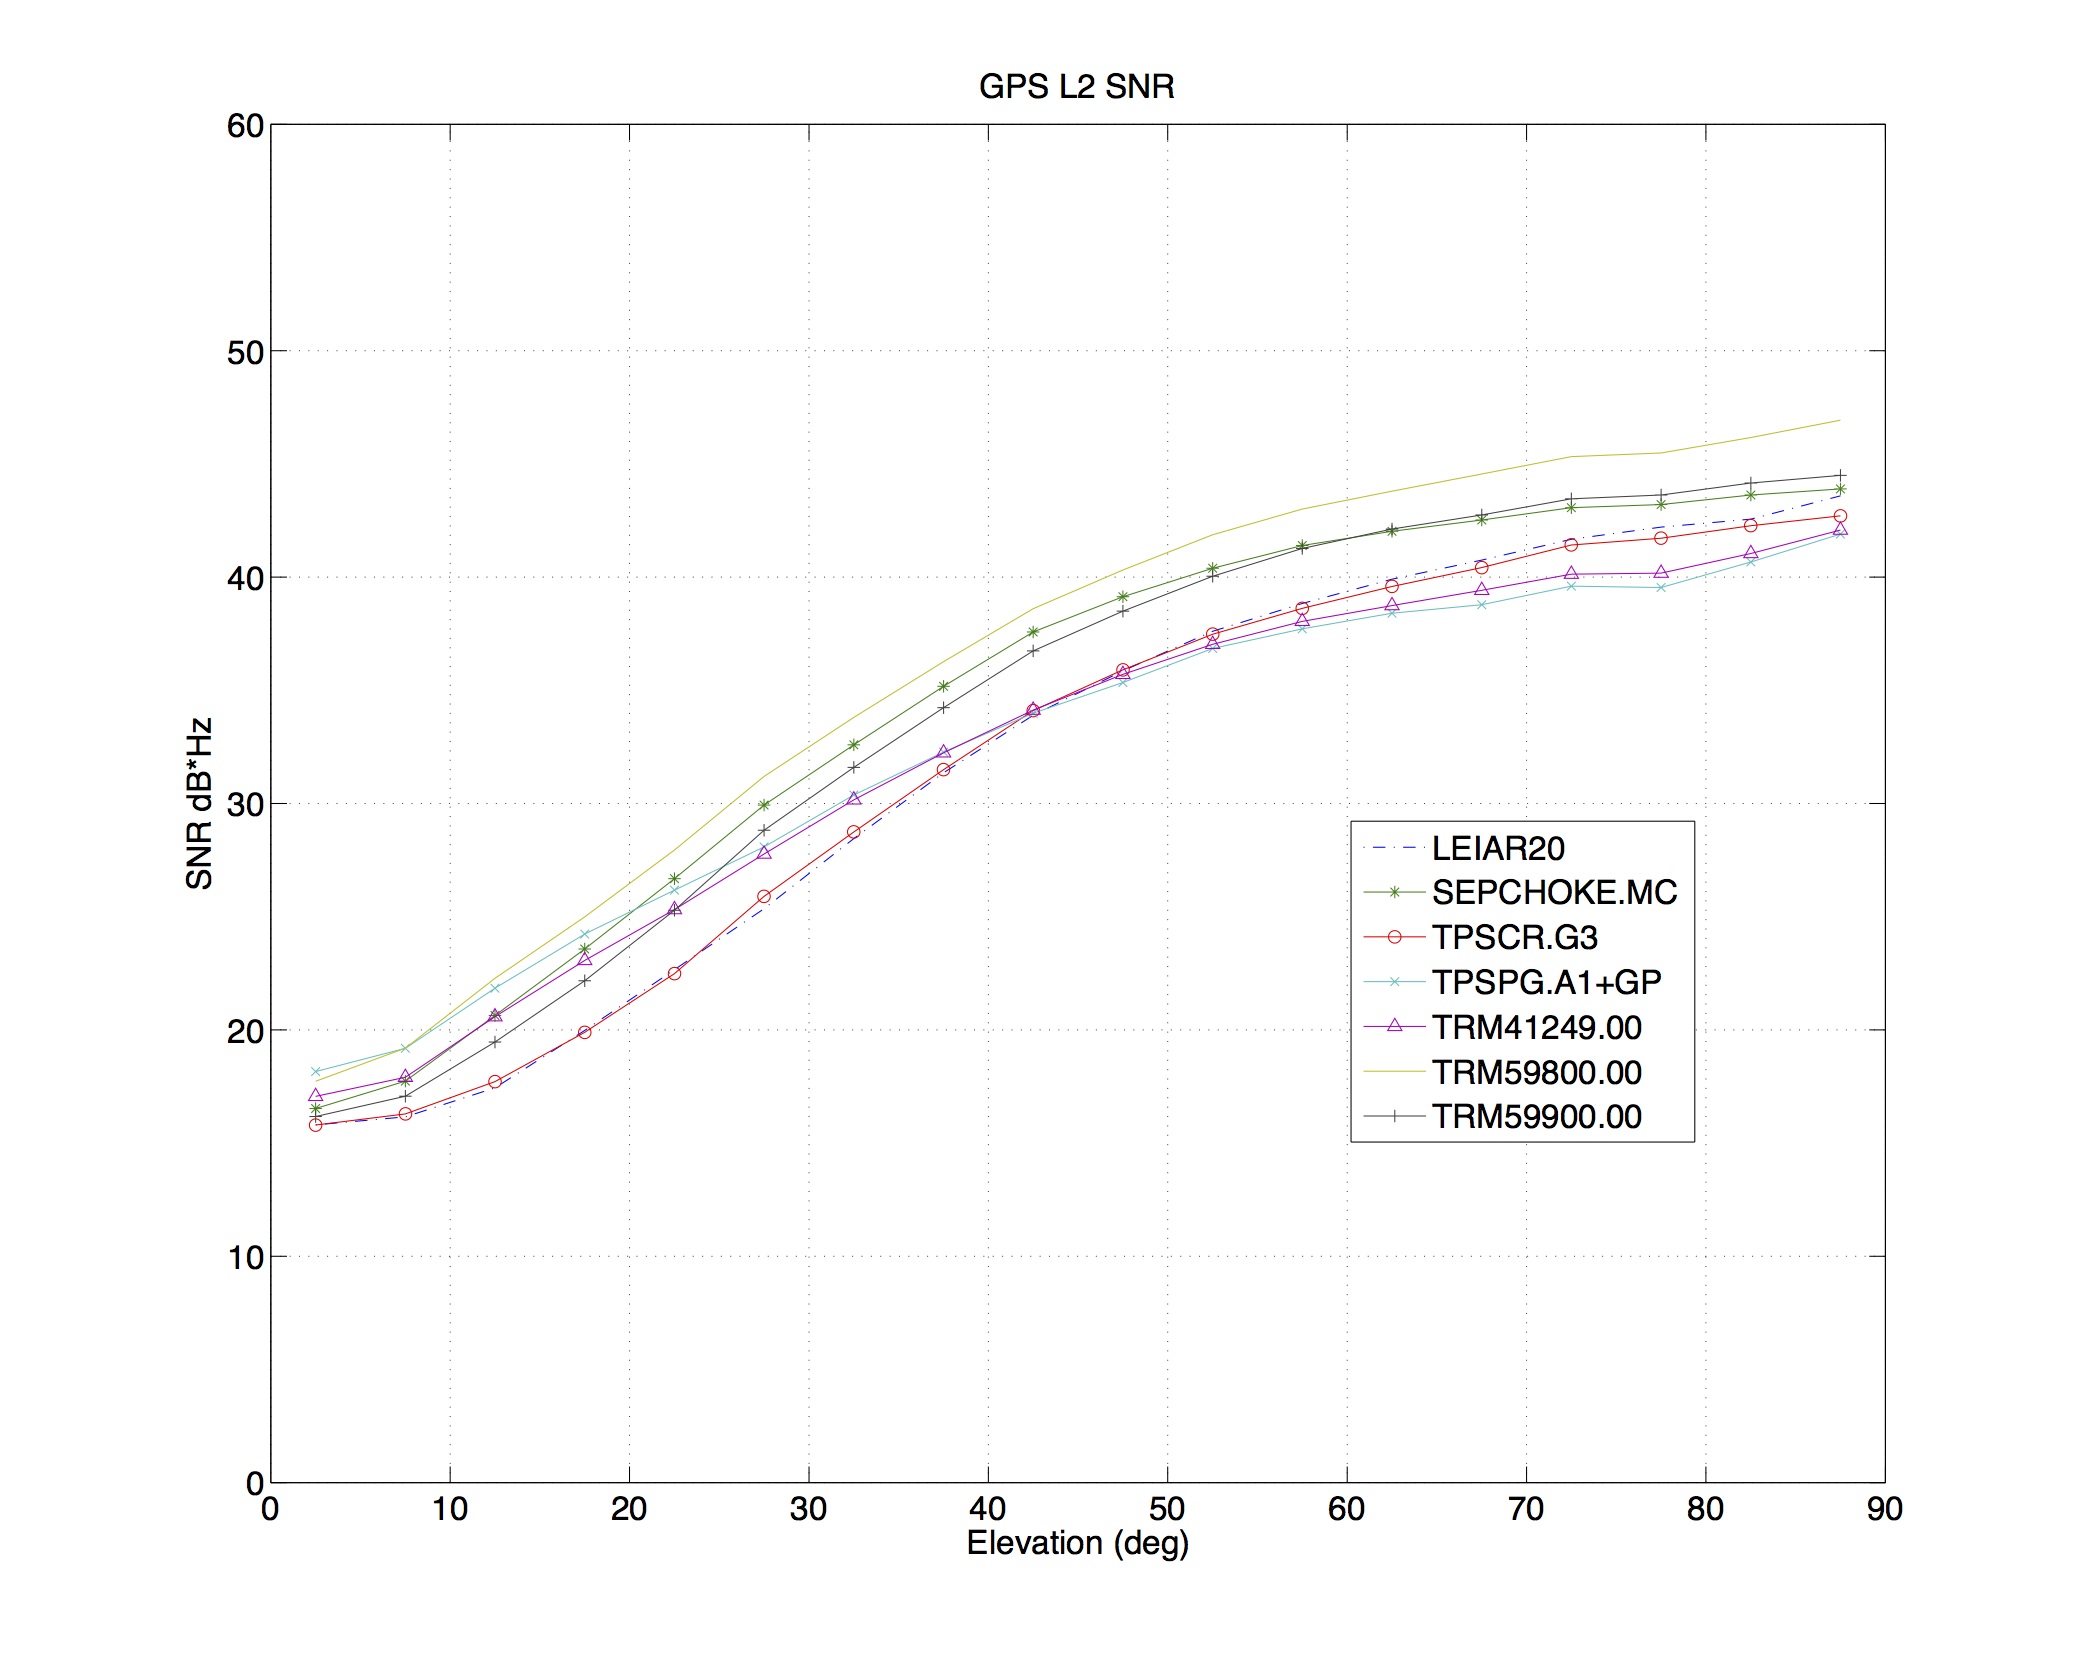
Figure 2. Computed four day averages of S2 in 5 degree elevation bins for each antenna type. (full size)

Figure 3. Computed four day averages of GLONASS S1 in 5 degree elevation bins for each antenna type. (full size)
| Antenna Model | Antenna Make | SNR Figures |
| LEIAR20 | Leica | figure |
| SEPCHOKE_MC | Septentrio | figure |
| TPSCR.G3 | Topcon | figure |
| TPSPG_A1+GP | Topcon | figure |
| TRM41249.00 | Trimble | figure |
| TRM57971.00 | Trimble | figure |
| TRM59800.00 | Trimble | figure |
| TRM59900.00 | Trimble | figure |
Table 1. Individual figures showing SNR vs. elevation angle for all PRN’s. The computed average and the standard deviation for each 5 degree elevation bin is also displayed.
Questions or Comments? Please contact Henry Berglund; email: berglund @ unavco.org